|
SINE WAVE
GENERATOR
SIGNAL GENERATOR
Here's a way to
generate and explore
the sine wave. You can change its Amplitude, Frequency, Offset, Phase and see the waveform change.
The VBA function is a simple equation.
To see the VBA code hit ALT-F11
and double click on the Modules > Module1 in the VBA Project window. This
opens the code window for this module.
Excel file:
EE_Sine_Wave.xlsm. Right-click on filename, then
"Save link as". In Windows, you may need to right-click
Properties > Security and check "Unblock".
| |
Function SineWave(t, Vp, fo,
Phase, Vdc)
' create sine wave
' phase in deg
Dim pi As Double
pi = 3.1415927
'Calc sine wave
SineWave = Vp * Sin(2 * pi * fo * t + Phase * pi / 180) + Vdc
End Function
|
The function calculates the value of the of
the sine wave at each time point t, given the
Vp -
Magnitude Peak (V)
fo - Frequency (Hz)
Phase - Phase (deg)
Vdc - Offset Voltage (V)
The phase gets converted from degrees to
radians inside the SIn function as
Phase * pi / 180
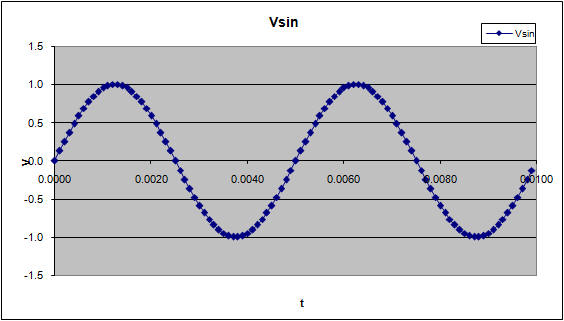
AMPLITUDE VERSUS TIME
You enter the description of the sine wave in
these cells.
|
Vp |
1 |
V |
|
VDC |
0 |
V |
|
fo |
200 |
Hz |
|
Phase |
0 |
deg |
|
|
|
|
|
dT |
0.0001 |
|
The time column is generated by entering the
time increment dT at location C14. Each time point is simply the previous
time point plus the delta, A17+$C$14. Note, that C14 is a fixed reference
point.
|
time |
Vsin |
|
0.0000 |
0.00 |
|
0.0001 |
0.06 |
|
0.0002 |
0.13 |
|
0.0003 |
0.19 |
|
0.0004 |
0.25 |
|
0.0005 |
0.31 |
|
0.0006 |
0.37 |
|
0.0007 |
0.43 |
|
0.0008 |
0.48 |
|
0.0009 |
0.54 |
The cells in the Vsin column holds the
function call. The first entry in this column looks
like
=SineWave(A17,$C$9,$C$11,$C$12,$C$10)
where A17 is the current time point and C9
through C10 hold the sine parameters. The fun part of this spreadsheet is changing the
parameters and then watching the plot change.
TRY IT!
- Sekect a parameter to
change - Vpk, fo, Phase or Vdc. Predict its effect on the waveform. Then
enter a new value and see what happens!
- Pick a higher
frequency like fo = 200Hz, 400Hz or higher. At what fo are there not
enough time points to define the sine wave? Change dT to get a better
view.
- Write a function to
create a Cosine wave. Name it "CosWave( )" " for example.
Create it using the
COS function or with the SIN function and a an added constant 90 degrees
to the Phase.
Back to Topics
|
|