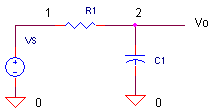
RC Low-Pass Filter
CIRCUIT
LPFILTER1.CIR Download the SPICE file
The RC Filter serves as an easy introduction into running SPICE simulations and plotting results.
What is the purpose of this circuit? The filter has
two roles:
-
Pass the desired low frequency signals (desired signals).
-
Stop the unwanted high frequency signals (noise and interference).
At what frequency does the filter change its behavior from passing the low frequencies to stopping the high ones? This is called the cut-off frequency.
![]()
For R1=1k and C1=0.032uF you get fc = 5 kHz.
SIMULATION STEPS
-
Right Click on "Download the file" and select "Save file as".
-
Start the SPICE program.
-
Select File > Open and select the netlist file “lpfilter1.cir”. Most simulators display the netlist in a text editor window. You can view, modify and save the netlist from this window.
-
Select Simulate > Run or hit the run icon.
-
In the plot window, select Plot Setting > Add Traces. Select V(2) to plot the voltage at node 2, for example.
FREQUENCY RESPONSE
Run an
AC (frequency) simulation by first removing the "*" in front of the .AC statement AND
placing an "*" in front of the .TRAN statement. Then hit the RUN
icon.
In the plot window, add traces for the AC results at output V(2). What does the magnitude look like at frequencies lower and higher than fc=5kHz?
-
f << fc - the response should show the low frequencies passing through at unity (0dB).
-
f >> fc - the response should start falling in magnitude as f increases.
TRANSIENT RESPONSE
Run an Transient (time) simulation by first removing the "*" in front of the .TRAN statement AND placing an "*" in front of the .AC statement. Then hit the RUN icon.
In the plot window, add traces for the input V(1) and output V(2). For R1=1k, C1=0.032uF and the sinewave generator at 2kHz, you should see the 2 kHz sinewave (desired signal) pass through to the output V(2) except for a slight decrease in signal and slight shift in time.
Now change the sinewave frequency to 40 kHz by editing the voltage source line to look like
VS 1 0 AC 1 SIN(0 1 40KHZ)
Save the file and run another simulation. Assume this 40 kHz signal represents the undesirable noise in a system. Did the filter reduce the 40 kHz signal?
PLAY IN THE LAB!
Let's make some component changes!
Change the value
of R1 to 2x higher or lower?
Can you predict what happens to your low-pass cuttoff frequency?
Run an AC sim to see the new response!
Now change the capacitor value.
This is the power and fun of SPICE simulation - to develop intuition and understanding by making value changes and predicting / verifying the result.
SPICE FILE
Download the file or copy this netlist into a text file with the *.cir extention.
LPFILTER1.CIR - SIMPLE RC LOW-PASS FILTER
*
VS	1	0	AC 1 SIN(0 1 2KHZ)
*
R1	1	2	1K
C1	2	0	0.032UF
*
* ANALYSIS
.AC 	DEC 	5 10 10MEG
*.TRAN 	5US  500US
* VIEW RESULTS
.PROBE
.END